Creating and Exporting Custom Reports
Table of Contents
Creating a Report
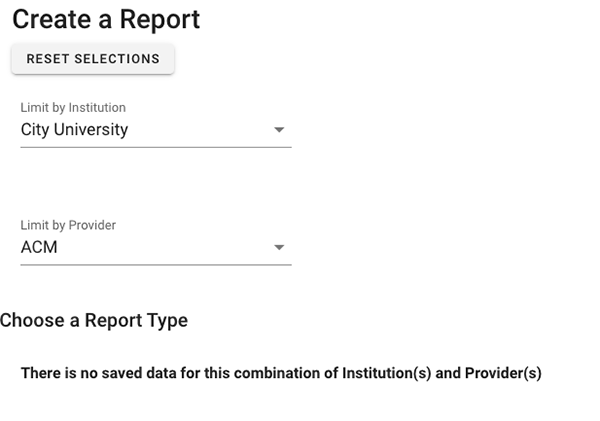
To create a report with CC-PLUS, you will select “Create” from the “Reports” option in the main navigation. Much like doing a manual harvest, the first steps include selecting the institution provider and report desired.
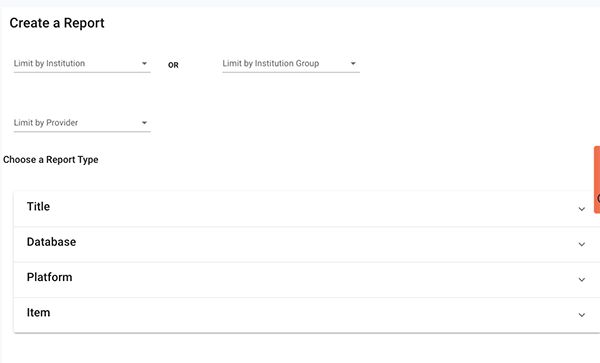
The drop-downs on this page for institutions and providers are limiters, meaning that if you make no selection here all institutions you have access to and all providers will be included in the report. Once you make a selection in any of these categories, the choices you have for reports will adapt to only allow you to create a report for which data is available. If you have selected to view a report for a group of institutions you will not be able to narrow by individual institution later when customizing the report.
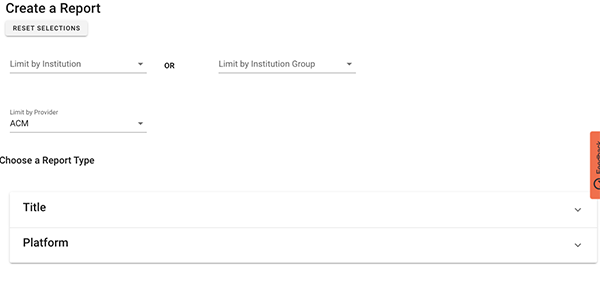
If you choose a combination of institution and provider for which no data exists, the system will let you know that no report can be created.
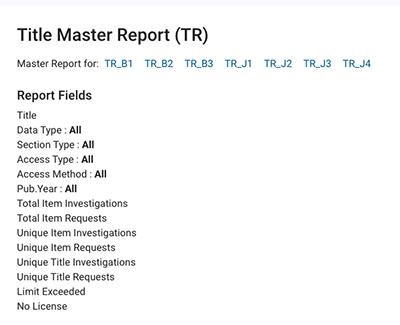
Next a report must be chosen from the list of available options. Clicking the down-arrow will roll out a full list of COUNTER-determined “views” for each type of report. A brief description of each is included.
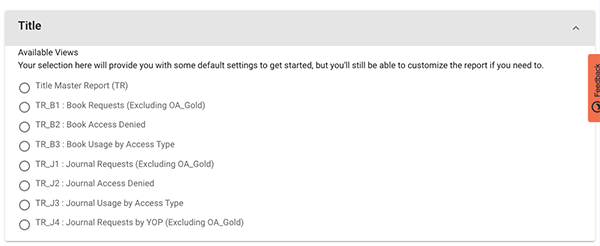
The Master report for each type includes all possible variables. The other options created various “slices” of that data with some variables included and others excluded. If you choose something other than Master report, however, you will be able to add columns back into the report in the next step.
Once a report is chosen, the final step is to choose the dates of the report and hit “finish”
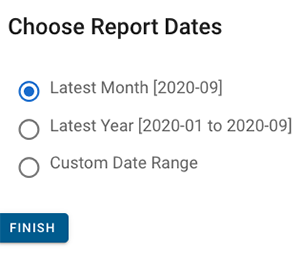
You will be taken to a screen to make any additional customizations or adjustments to the report before you export it.
Customizing a Report
On the initial report screen, you are presented with configurable options for date, columns or variables of data, and filters for those variables.
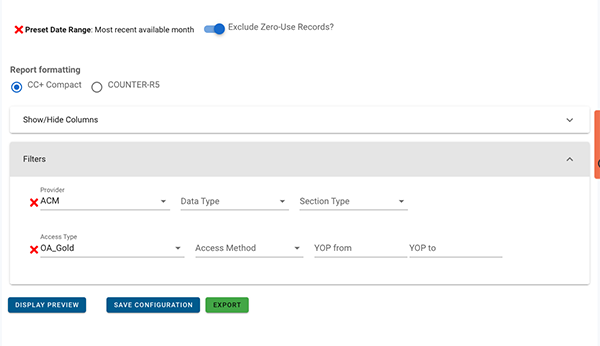
Expanding the Show/Hide Columns area allows you to add or remove variables that will show up as columns of data in the report.
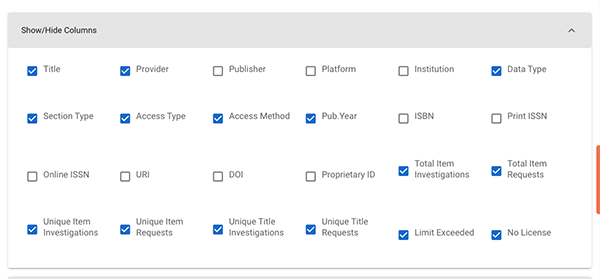
The filters underneath the list of columns will change based on your selections.
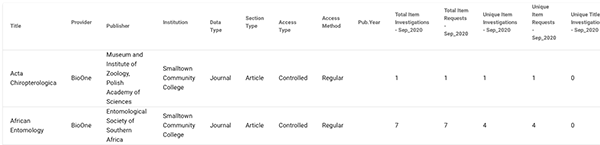
Once you have chosen your columns, hit the “Display Preview” button to get a preview of the first 100 rows of data that will be in your exported report.
This will allow you to verify that you have included all the data you want in your final report. You may further adjust the columns and filters and hit the “Refresh Preview” button to update the table shown.
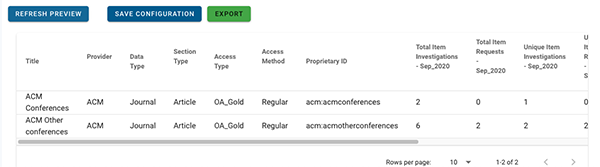
Additionally, you have two options for how the data within the report is formatted. The default is called the “CC+ Compact” format. This lists every title for which there is data in a single row and breaks up different metrics into separate columns.
As you can see in this Title Report example from September 2020, each metric type has its own column. If more months were included, each combination of month and metric would add a column. This option makes it easy to add up all usage per title regardless of metric type. It is also the quickest report for CC-PLUS to generate.
You also have the option of formatting the report according to the COUNTER format which creates a new row for each metric type.
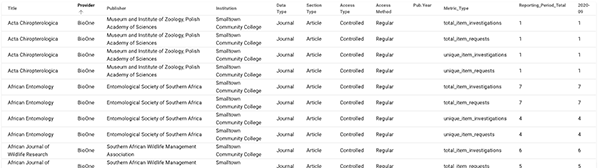
The format option is selected at the top of the page, just under the date options.
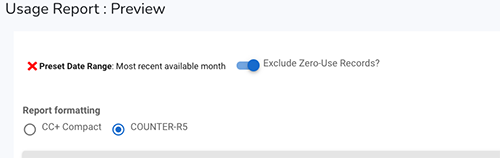
Just like with other options, if you change the format type, you must hit “Refresh Preview” to see the change displayed at the bottom of the page. COUNTER formatting takes longer for CC-PLUS to generate, particularly for large reports.
Exporting a Report
All reports are exported as a file with the “.csv” (comma separated values) extension which can be opened with any spreadsheet or text editing software.
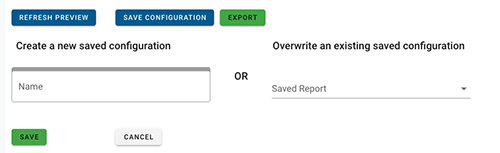
Saving a Report
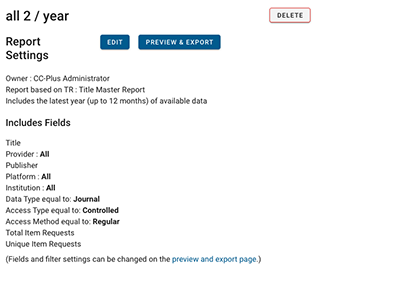
If you are happy with the report you have created and it is something you want to be able to come back to regularly, you can use the “Save configuration” option to create a link on your home page directly back to this report. (Note: if you chose “last month” or “last year” for your date settings, the direct link will always go back to the latest month or year from the current date. If you select a custom date, with a specific begin and end, the link will always return you to a report for those specific dates).
To save a configuration you just have to give it a name. You may also overwrite an existing saved report to update it.
Once the report is saved, you will see a link to the report from the home page and the Report List:

The Report List
The Report List linked from the “Reports” option in the main navigation lists the specifics for every COUNTER report and view as well as the custom configurations you save.
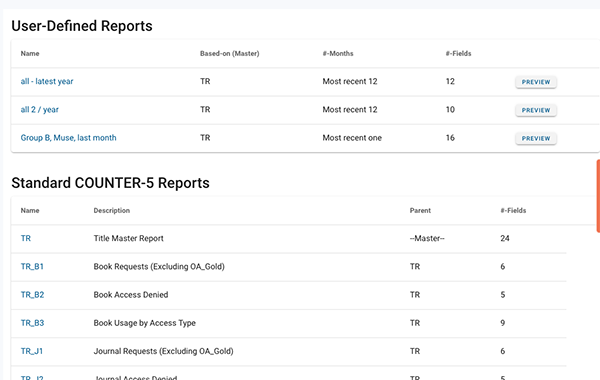
Each report is linked to a page describing all of the specific parameters and filters for that report or view.